|
|
|


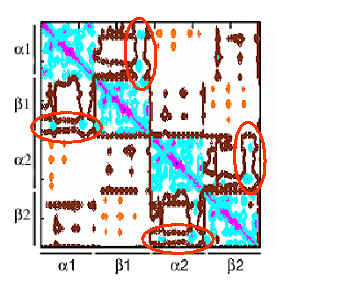 |
The two axes refer to residue indices. The regions colored magenta, blue, brown and orange refer to strongly correlated, correlated (Cij > 0), uncorrelated (Cij » 0) and anticorrelated (Cij < 0) pairs, respectively. The subunits are indicated by the bars parallel to the axes. Blue blocks indicate positively correlated units (intrasubunit correlations for a1, b1, a2 and b2 domains) and the off-diagonal encircled (by red ellipses) blue regions indicate the interdomain correlations between subunits a1 (or a2) and b1 (or b2). Anticorrelated (concerted but opposite direction) motions are observed for the subunit pair a1- a2, as well as the pair b1- b2. Results are presented for 1a3n. 1bbb and 1hho showed similar behavior. |
Energy surface in the close neighborhood of the original structure, shown for (a) the T form, and (b) the R2 form of the Hb tetramer.
|
|
|
The ordinate represents the
conformational energy estimated from pairwise addition of the
Miyazawa-Jernigan inter-residue contact potentials for all pairs of
residues whose a-carbons are
located within rc = 6.5 Å .
The abscissa refers to
different conformations generated by rescaling the extent of
deformation predicted by the ANM. Quantitatively, these conformations
are generated by adding to the original residue position vectors the
fluctuation vectors, multiplied by the scaling factor indicated along
the abscissa. We note that one of the fluctuation directions,
indicated by the arrow, is more favorable. These directions exactly
coincide with that of the global reconfiguration in the T
ßà
R2 transition.
|
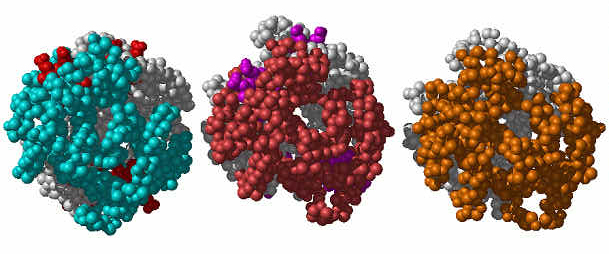
Comparison of the T (left), R2 (middle) and reconfigured T (right) forms of Hb.
|
|
The T and R2 forms refer to the PDB structures deoxy-Hb and CO-bound Hb. The reconfigured T is predicted using scaling factor 4. We started from the T form and compute its most probable global change using ANM. Note the similarity between the relaxed form predicted by our computations (bottom) and the experimental R2 form (middle) (rms deviation 2.32 Å). |